

Development Appraisal
Pencil, Development Advisory
Any deal appraised in minutes, not days. Enterprise-grade architecture replaces the spreadsheet, so every output is consistent, traceable, and defensible.
Minutes
From assumptions to a full appraisal
Gap Solver
Tells you what has to change to hit your target return
IC and Bank-ready
Bankable cash flow and a scored pack in one click
Live to handover
Load actual spend and sales as you build
Overview
Your next deal is sitting in a spreadsheet, waiting. An analyst builds the model, a manager checks it, and days later it reaches the person who actually decides. One broken formula and the whole appraisal is wrong, but nobody catches it until the bank does.
Pencil ends that. Enter what you know, whether that is a headline rate per square metre or costs down to the BOQ line, and the full appraisal builds instantly: returns, cash flow, funding, sales absorption across mortgage and cash buyers. Change a price or a build cost and every number moves with it.
When the deal stacks up, you export the investor memo, the IFRS-ready accounts and the sensitivity analysis in one click. Every assumption is visible, so when the board or the lender asks how you got there, you can show them.
Capabilities
- Full appraisal in minutes, not days
- Model at any depth: per square metre, per floor, per unit or per BOQ line
- Sales absorption tracked across mortgage and cash buyers
- Gap Solver: tells you what has to change to hit your target return
- Scenarios, sensitivity and side-by-side case comparison
- Development and takeout debt, with cover ratios lenders test
- Income statement, cash flow and balance sheet, IFRS 15 ready
- Investor memo and IC pack exported in one click
- Stays live through construction: load actual spend and sales against budget
Core Capabilities
Everything the platform brings together
Site to Profit
Everything between the land price and the return: acquisition, statutory costs, construction budgets, revenue, finance costs, profit, IRR and equity multiple.
Capital Structure Modelling
Structure debt, equity, customer collections, JV participation, drawdowns and capital calls, with peak equity and peak debt surfaced month by month.
Cash Flow and Draw Schedules
Track monthly project cash flow, debt utilisation, cumulative spend and the month the project starts funding itself.
Deal Scoring
Score each deal against your own covenant hurdles, see which tests fail, and get pointed at the restructuring that fixes them.
What-If Sensitivity
Stress-test sales pricing, construction costs, velocity, finance assumptions and capital strategy, then compare cases side by side.
Professional Reports
Export feasibility outputs, investor memos and full IFRS statements for lenders, investors, boards and internal approvals.
Plans
Start with a worked appraisal for free. Upgrade when you want to model your own deals.
Free
See what the model does
$0
No card, no setup fee.
What you can do:
- Open a complete worked appraisal
- Returns, cash flow and financial statements
- Sensitivity analysis on the four drivers
- Every assumption visible, end to end
- One worked appraisal
- No card required
- Upgrade any time
Basic
For your first live deals
$30 /mo
$25/mo billed annually
+ $1,900 one-off setup
Everything in Free, plus:
- Build and edit your own appraisals
- Your own unit mix and sales terms
- Your own BOQ costs and financing
- 3 seats
- 3 projects
- 6 scenarios
Professional
Most chosenFor a working pipeline
$70 /mo
$58/mo billed annually
+ $3,800 one-off setup
Everything in Basic, plus:
- Land JV — Structure the land owner's share as a % of units or a % of profit.
- Bulk Sales — Model a discounted block sale of units to a single buyer.
- Sales Grid — Override base price and floor per unit, on top of the type average.
- REIT Costs — Apply the REIT fee structure to the operating cashflow.
- Gap Solver — What to change, and by how much, to move a target metric.
- Case Comparison — Worst / Best thresholds across the four drivers, recomputed live.
- 5 seats
- 10 projects
- 24 scenarios
Institutional
For a portfolio, and for building
$110 /mo
$92/mo billed annually
+ $7,600 one-off setup
Everything in Professional, plus:
- Portfolio — Group properties, set a base currency, and roll up across the pipeline.
- Under Development — Track a live project's construction actuals and unit sales against the study.
- 10 seats
- Unlimited projects
- Unlimited scenarios
What each plan unlocks
Every module, and the tier it becomes available on.
| Module | Free | Basic | Professional | Institutional |
|---|---|---|---|---|
| PortfolioGroup properties, set a base currency, and roll up across the pipeline. | Not included | Not included | Not included | Included |
| Under DevelopmentTrack a live project's construction actuals and unit sales against the study. | Not included | Not included | Not included | Included |
| Land JVStructure the land owner's share as a % of units or a % of profit. | Not included | Not included | Included | Included |
| Bulk SalesModel a discounted block sale of units to a single buyer. | Not included | Not included | Included | Included |
| Sales GridOverride base price and floor per unit, on top of the type average. | Not included | Not included | Included | Included |
| REIT CostsApply the REIT fee structure to the operating cashflow. | Not included | Not included | Included | Included |
| Gap SolverWhat to change, and by how much, to move a target metric. | Not included | Not included | Included | Included |
| Case ComparisonWorst / Best thresholds across the four drivers, recomputed live. | Not included | Not included | Included | Included |
Prices in USD, excluding VAT, applied at the rate for your billing country.
Pencil In Action
See it work on a real deal
A residential scheme from first assumptions to the pack that goes to the investment committee. Every screen below is the live model.
01
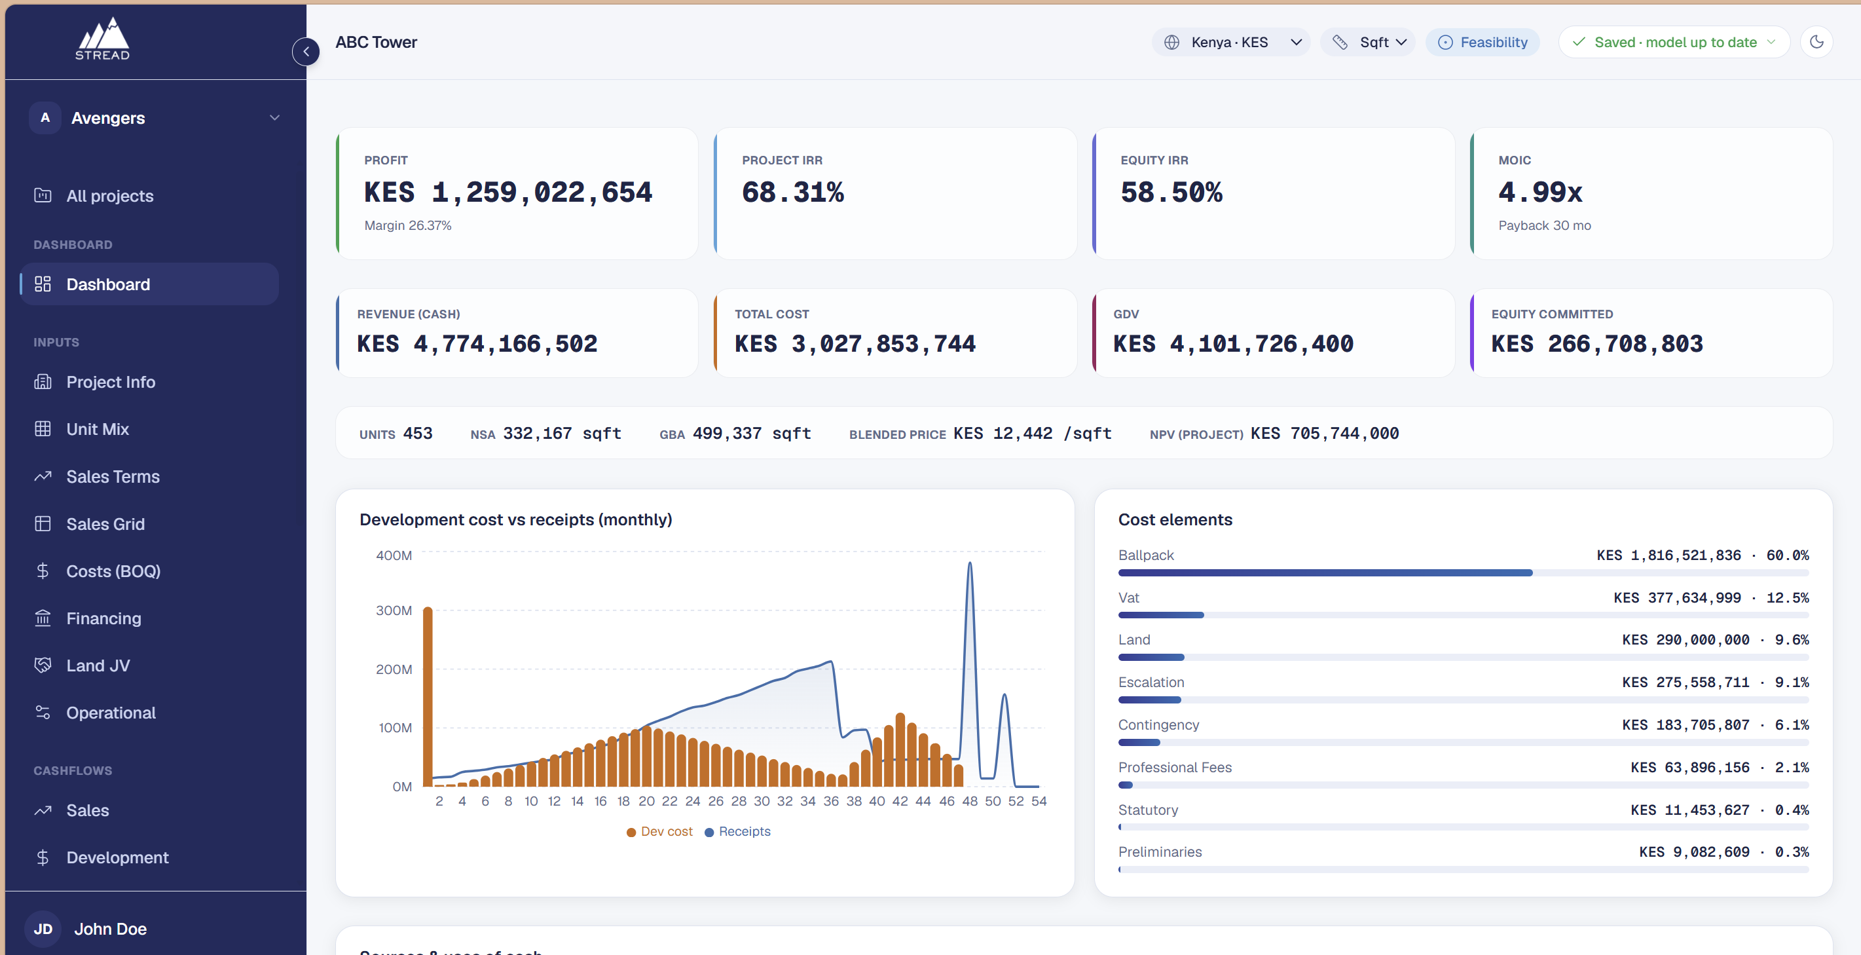
Does this deal work
One screen answers it: revenue, cost, profit, IRR and equity multiple, with the capital stack auto-balanced. Move the sliders on price, cost or sales pace and every number reprices instantly.
02
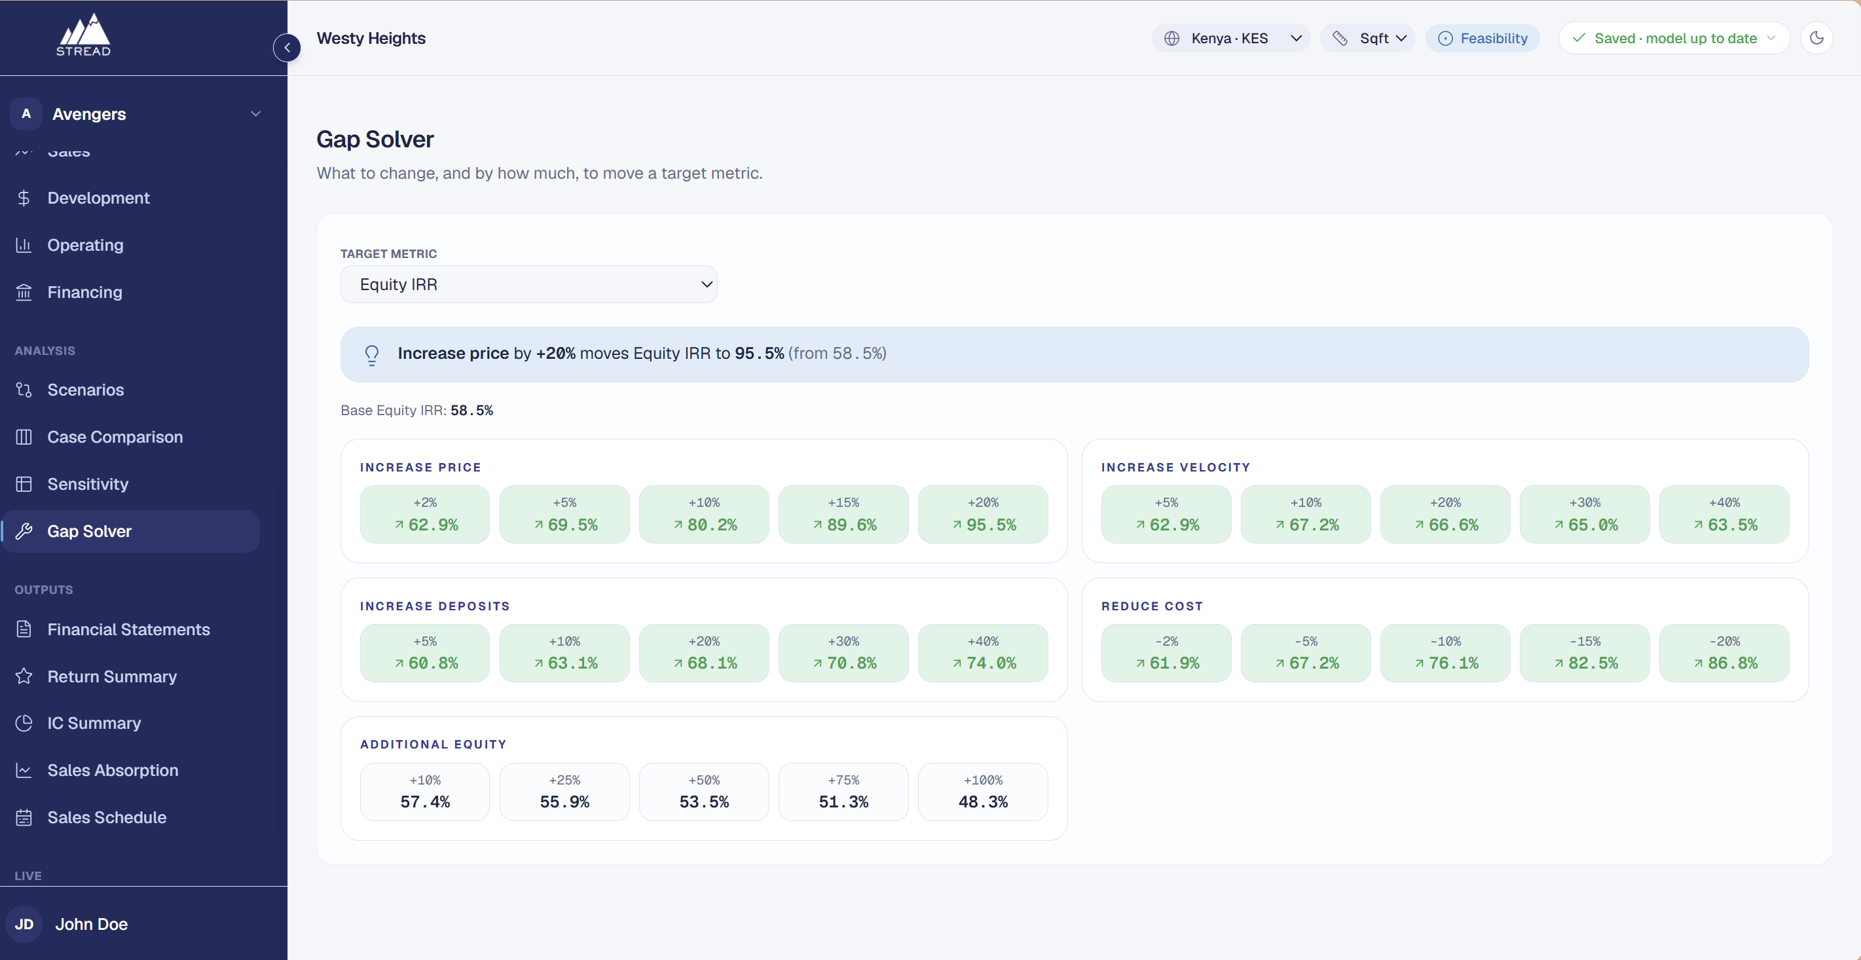
What has to change to make it work
Set the return you need and Gap Solver works backwards, telling you the sale price, cost saving or velocity required to get there. No more guessing at inputs until the answer looks right.
03
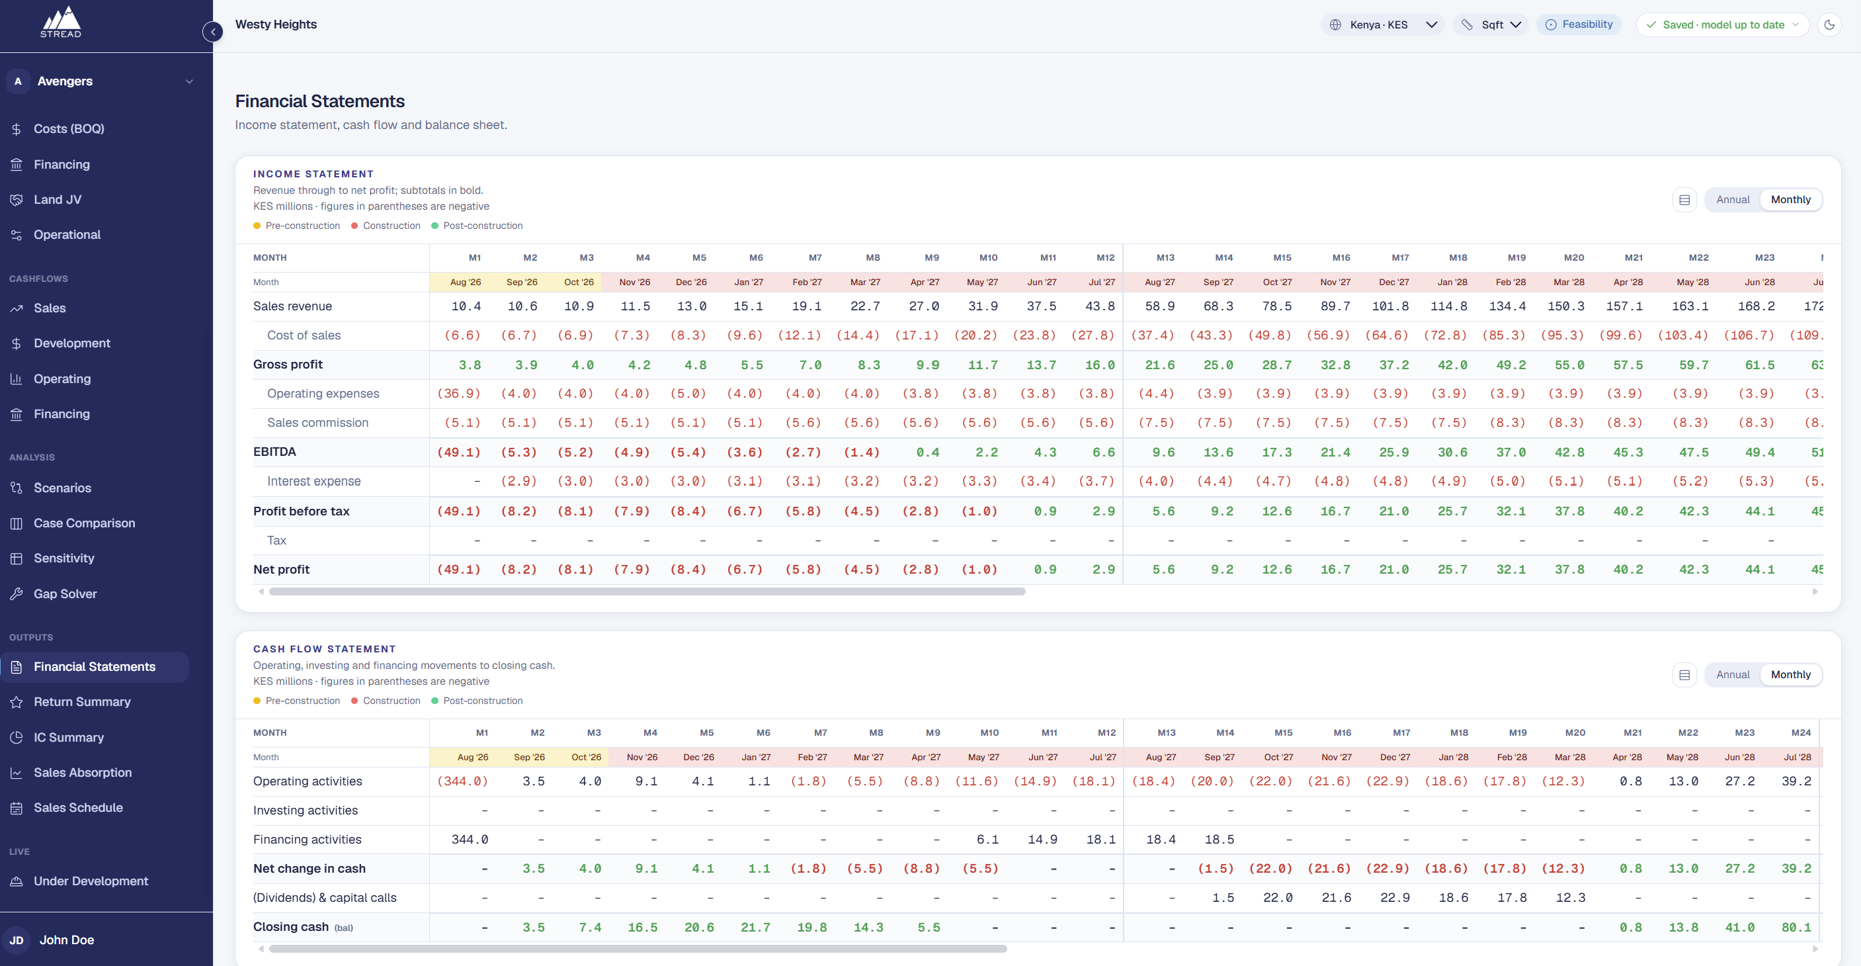
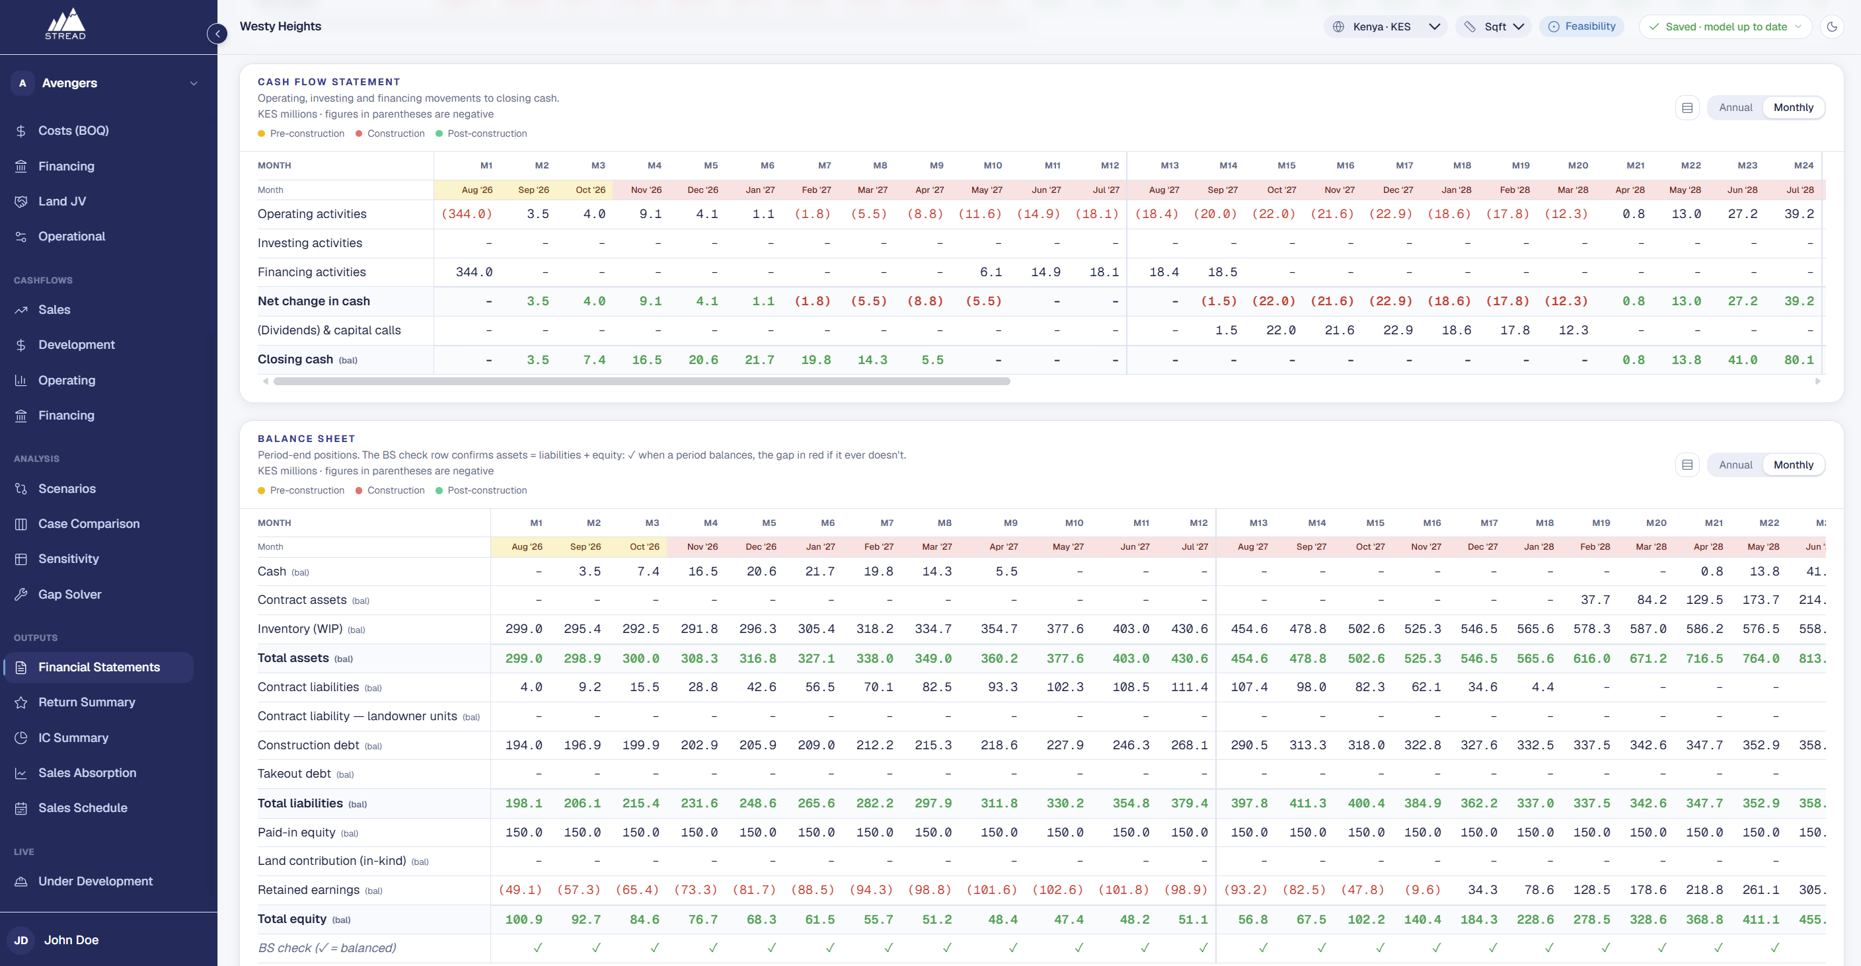
Accounts your auditor recognises
Not a returns summary: a full income statement, cash flow and balance sheet, with revenue recognised over time under IFRS 15 and a balance check on every period.
04
The pack that goes to the committee
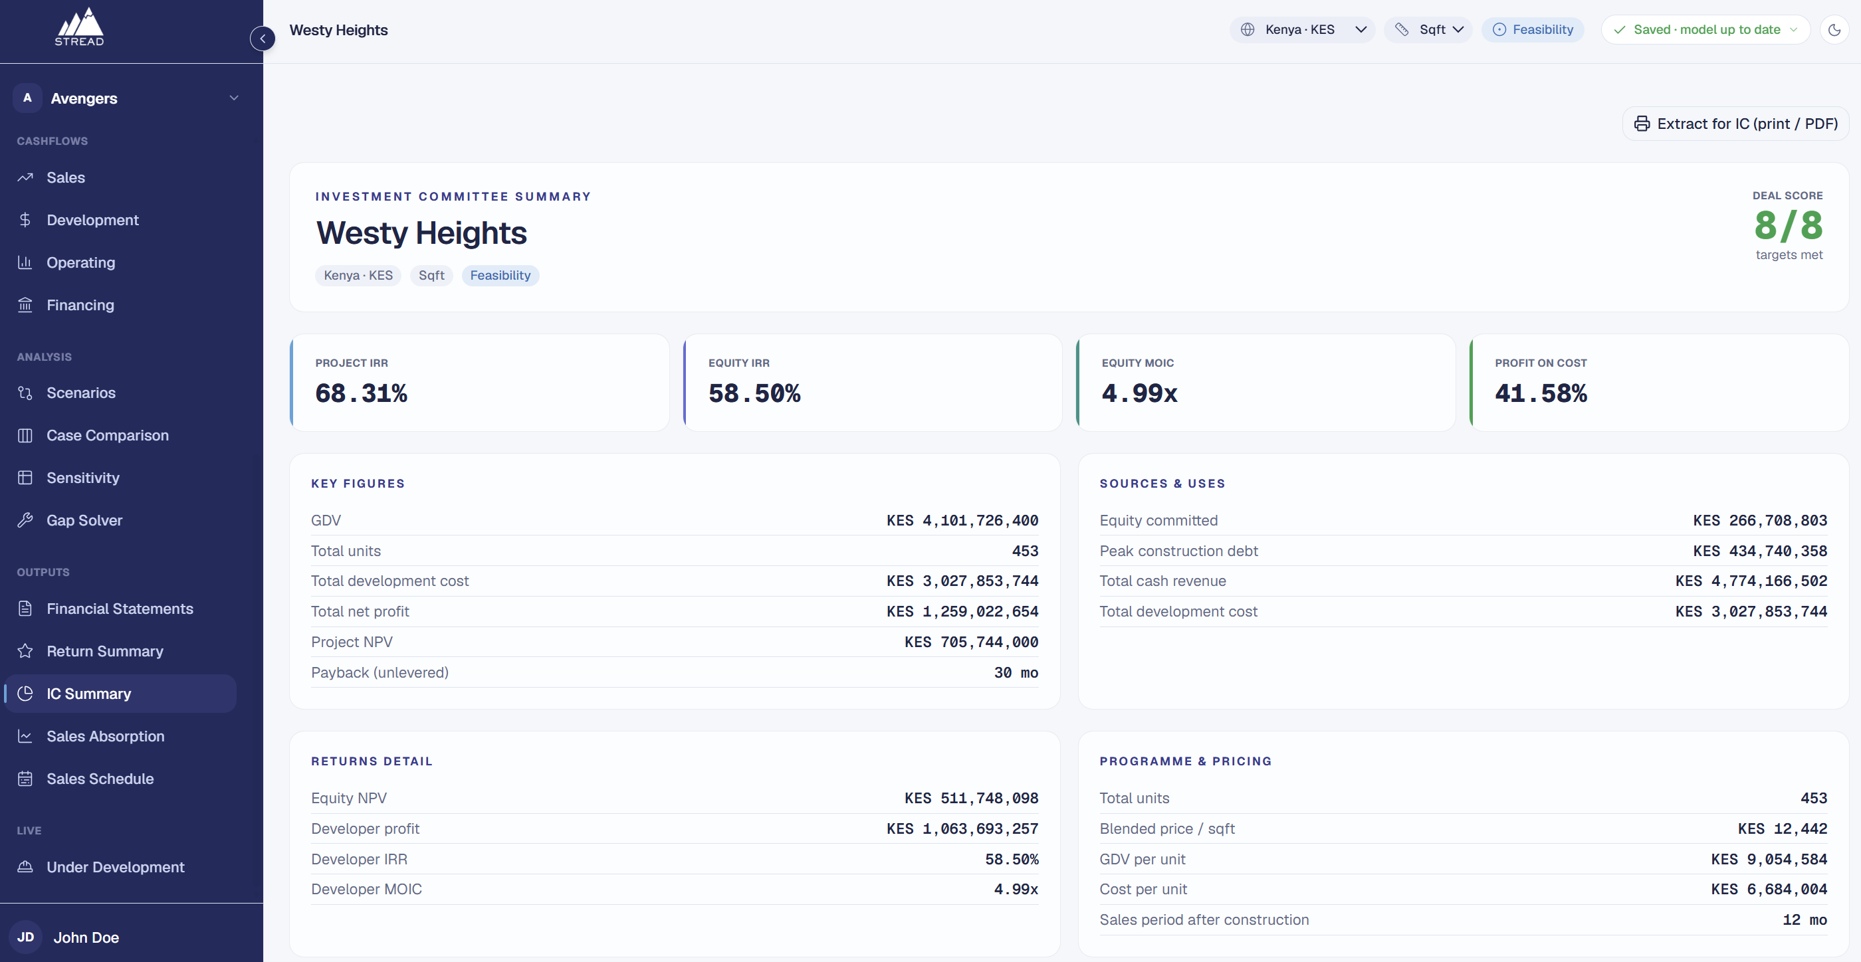
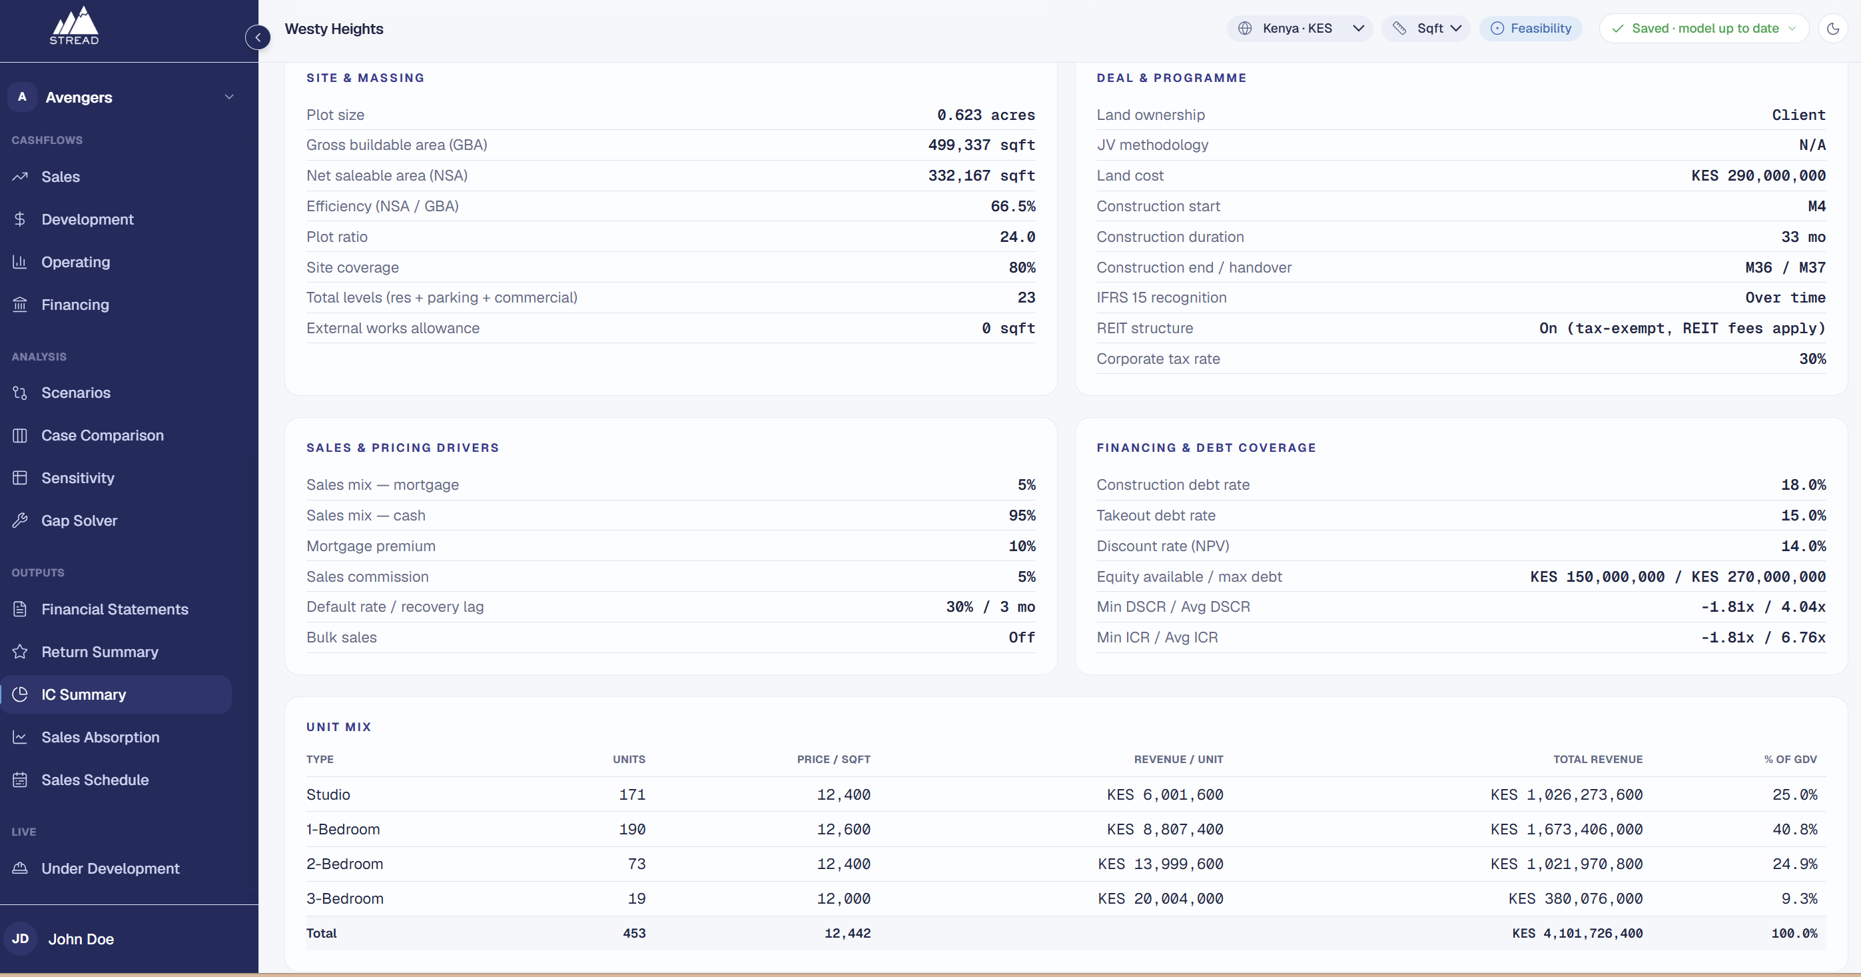
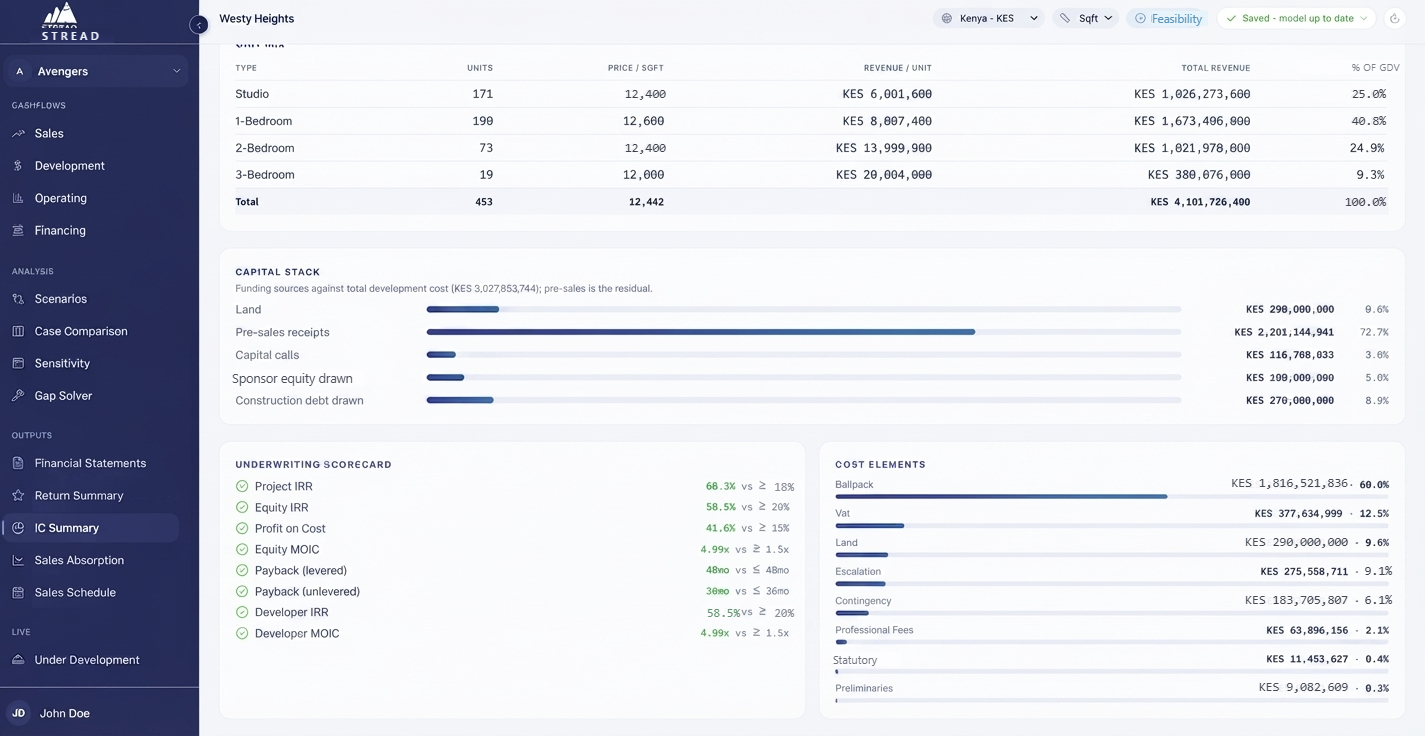
Deal score, covenant tests, capital structure and the full financial statements, exported as one investment committee document. Nothing re-typed, every assumption traceable.
What's included
Why choose Pencil, Development Advisory
Enterprise-grade architecture, not a spreadsheet, so every model is consistent, traceable and audit-proof
Full appraisal in minutes, not days, with every number repricing the moment an assumption changes
One model, one set of numbers, so analysts, management and the board work from the same source
Reporting built in: investor memo, IFRS 15 statements and IC pack exported in one click, nothing re-typed